Visualizing your workflow is a key component of agile methods. But if we want to solve problems, we have to do a bit more than just visualize them with sticky notes. We have to perform some actual problem management. And to manage problems, a good start would be to measure them.
Visualizing your workflow is a key component of agile methods. But if we want to solve problems, we have to do a bit more than just visualize them with sticky notes. We have to perform some actual problem management. And to manage problems, a good start would be to measure them.
Peter Drucker once famously said, “What gets measured gets managed.” Therefore, a good question is, “How can we measure our problems in an effective way so that they get solved and things will improve?” [1]

A common mistake is to assume that the number of problems is a decent key performance indicator of organizational dysfunction. After all, the thinking goes, the more problems we have on the backlog, the worse our performance must be. However, this is not necessarily true. By measuring and reporting the number of problems in a distrustful environment, we easily get into a situation where people feel pressured not to add more problems to a large queue in order to prevent the metric from growing even larger. The result is a visible backlog of reported and managed problems and an invisible backlog of unreported and unmanaged problems.
Another mistake is to think that when the queue size is stable, we have things under control. Before anything else, we must keep in mind the perspective of the stakeholder. What does anyone who reports a problem want? They want their problem to be fixed—and sooner rather than later. When this week’s problem queue is exactly the same as last week’s problem queue, does that mean our performance has remained the same as the week before? No! The people who reported the problems have now been waiting an extra week for us to fix them. Therefore, the metric we use should reflect that our performance has worsened. Any metric we come up with should incorporate the age of the problems.
The Age of the Problems
We should not penalize anyone for reporting problems. But we should penalize ourselves for not solving those problems rapidly. Finding one defective cash machine at an airport is a minor inconvenience. The machine could have broken down an hour ago. But finding five broken machines (as I did in Buenos Aires last year) indicates a severe organizational dysfunction. And if those same machines are all still broken the following week, things are even worse than we thought. The longer a problem remains unsolved, the heavier this must weigh on our improvement index.
Most organizations don’t pay attention to queues. Instead, they pay attention to the time it takes to give customers what they want or the time it takes to develop something. In a way this makes sense, because customers don’t care about the size of queues. They care about their time. Two metrics are often mentioned in performance management literature: lead time and cycle time. Lead time is the time measured from the moment a customer reports an issue until the moment the customer considers the matter solved. Cycle time is the time measured from the moment work to address an issue starts until the moment the organization considers the matter closed. Logically, cycle time is always shorter than (or equal to) lead time.

Lagging Indicators
Like queue size, lead time and cycle time are useful metrics, and like queue size, the metrics suffer from a few issues. One important problem with lead time and cycle time is that the data only becomes available once the problems have been solved. These metrics are a typical example of lagging indicators. They are only known after you’re done. Consider the example of long lines in a supermarket. By only measuring lead time and cycle time, you will not know about the build-up of your customers’ frustration while they are inside the supermarket. You will only know about the long time they have been waiting in the queues after they have slammed the doors behind them on their way out—possibly never to return.
Another issue with lead time and cycle time is that these measurements originate from the manufacturing sector and are used to manage inventory of unsold physical goods, such as cars and books. Unsolved problems in an organization can be treated metaphorically as if they are unsold inventory, but reported problems are definitely not the same thing as physical inventory. The inventory metaphor breaks down easily. For example, two reported problems could later turn out to be the same problem viewed from different angles. I’ve never heard of anyone merging two unsold cars!
A Mindset Shift
The third and most important argument against a focus on lead time and cycle time comes from queuing theory. It appears that measurement of queues is much more effective than measurement of waiting time. Again, consider supermarkets: All successful supermarkets have figured out that they must monitor the lines of people waiting to pay and keep those lines small. Customers regret the loss of the time they have spent waiting, and if the organization keeps its focus on queues, it turns out that people’s waiting times will drop automatically. And information about queue size is available long before lead time and cycle time. It is a leading indicator of the happiness of clients.
Unfortunately, most organizations do not monitor the size of queues or the number of problems that have been reported to them. If they measure anything at all, it is usually the time it took them to solve a specific customer’s problem or the time it took to develop something. For most workers, it requires a complete mindset shift to change focus from lead time and cycle time to their work in progress. When we measure and manage our work in progress, the waiting times for clients will take care of themselves. [2]
Great Performance Measurement Using Two Metrics
When it comes to solving problems, measuring queue size (or work in progress) is better than measuring lead time and cycle time. And a static queue size does not express the growing frustration among stakeholders regarding the aging of their unsolved problems. Visualizing queue size alone does not incentivize people to report new problems.
As someone who is responsible for the organization, I value three things:
1. Reported problems are better than unreported problems.
I want all problems to be reported. No problem should be kept hidden. People should feel safe and incentivized to report any issue they find.
2. Young problems are better than old problems.
I want problems to be solved fast. They should not linger around on backlogs and boards for long because frustration grows with the age of problems.
3. One-time problems are better than recurring problems.
I don’t want the same problems to pop up again and again. Once solved, they should remain solved for good. Permanent fixes are preferable over short-term workarounds.
Given these three requirements, I believe we should measure the total age of all problems. Every week, we can spend a few minutes evaluating the entire list of open problems that have been posted on a wall or stored in a shared online tool. We then add a dot (or a point or a plus) to each problem that is still open. The number of dots (or points or pluses) per problem indicates how long this issue has been waiting to be solved. We can only remove a problem when the person who reported it agrees that the matter has been resolved. And, most importantly, when the same problem is reported again by another client, we reintroduce the issue in the queue, starting with its former number of dots. (Apparently, the problem was not properly solved!)

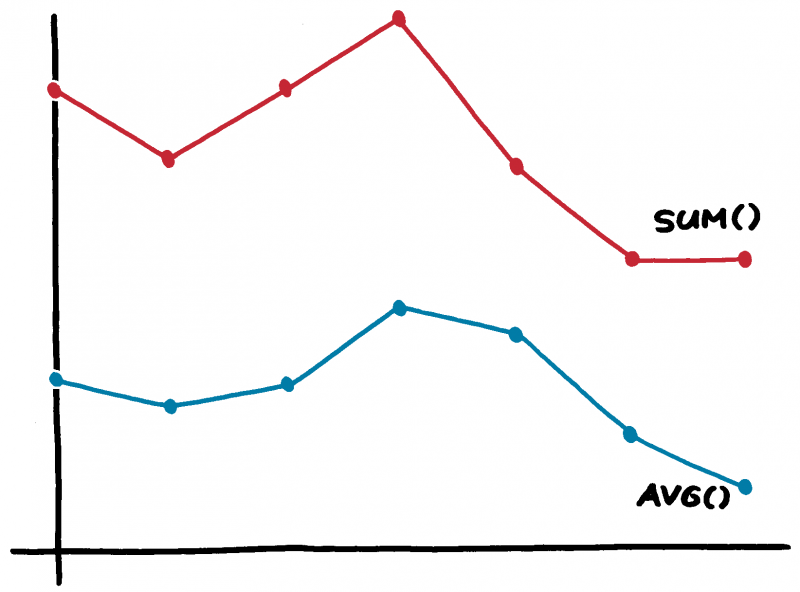
Once per week—or more often, depending on the nature of your business—we calculate the sum and average of all the dots and we report the results to everyone who is part of the system. What you measure is what you get, and with these two metrics, total problem time and average problem time, we get exactly what we want. People feel an incentive to report new problems, partly because adding fresh problems can bring the average problem time down (but not the total sum). They also feel an incentive to solve problems on the board because this brings the total problem time down (but not necessarily the average). And when creative networkers focus mainly on solving problems that have already been on the backlog for a long time, they will reduce both the total time and the average problem time. Last but not least, there is an incentive to solve problems for good because this prevents them from reappearing on the backlog. And we don’t want our clients to keep encountering the same problems, do we?
Problem time is different from queue size because problem time can increase while queue size remains static, indicating a (possibly) growing frustration of clients who are waiting for their problems to be solved. Problem time is also different from lead time and cycle time because lead time and cycle time are measures of completed work—they are lagging indicators—while problem time has an exclusive focus on uncompleted work—a leading indicator.
Visualizing the workflow in your organization is a great idea. But it could also be a great idea to visualize the frustration in the system.
1. Seddon, John. Freedom from Command & Control: Rethinking Management for Lean Service. New York: Productivity Press, 2005.
2. Reinertsen, Donald G. The Principles of Product Development Flow: Second Generation Lean Product Development. Redondo Beach: Celeritas, 2009.

